In my second semester, I participated in RaMP (Biomedical Research and Mentoring Program). I worked under my mentor Xiaoxian An, a pharmacology Ph.D student, in Dr. Pixley's lab for the semester. Most of what I worked on in the lab involved the looking at the foreign body response when magnesium was incorporated into a fabric implanted subcutaneously into mice. They found that the presence of magnesium in the fabric caused the wound healing process to occur sooner than with the fabric with no magnesium.
I mainly worked on image analysis which involved using the computer programs Photoshop, Excel, ImageJ, and SigmaPlot. I worked with two sets of images: images of tissue that were immunostained and images of tissues that were H&E stained.
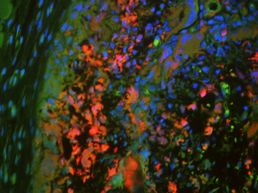
For the immunostained images, I used all four computer programs to determine M1 and M2 macrophage expression. M1 macrophages are associated with the body's inflammatory response to a foreign body while M2 macrophages are associated with the body's anti-inflammatory response. I worked with images of tissue samples from day eight. Each image was taken three times at different wavelengths to capture a different stain. The three stains used were dapi for nuclei, iNOS for M1 macrophages, and ARG1 for M2 macrophages. I had to combine the three images and add colors to each layer (blue for dapi, green for M1, and red for M2). Two to three of the colored images made up an image of a larger section of tissue, so I then went in and lined up the images to produce a larger image that ends up looking like the one on the left (the banner at the top is actually a zoomed-in version of this photo). ImageJ was then used to measure the expression of the macrophages and the nuclei. These values were then compared to one another using SigmaPlot.
For the H&E stained images, the number of neutrophils in a given area of tissue was counted. Neutrophils are another indicator of the body's inflammatory response to a foreign body. For the images that were H&E stained, the number of neuclei were in a given area of tissue (the rectangle) was counted to determine neutrophil infiltration. For each image, I placed a rectangle of a certain size and counted the number of nuclei and the percent area of the nuclei within that area. A sample of what the rectangle looked like can be seen in the slide show below on the second slide. It is the image under H&E staining. I did this process twice per image to gather information from two different areas of the tissue. SigmaPlot was used to ananlyze the data in the end.
I also performed a little bit of staining, but overall, my wet lab experience was limited. For the majority of the semester, data analysis was being performed on the magnesium fabric project. I never realized how much time is spent analyzing data. If an image seemed to have something wrong with it such as the staining being off or the data collected seemed to not make sense, that part of the project had to be redone. Before I started, the lab members had already gathered the data from tissue on days one and three, so they had been analyzing the data for months before I started. The process of image analysis also taught me how valuable knowledge of different computer programs is for a researcher. Just about everyday I came into the lab I was using at least one of the four computer programs mentioned earlier. Dr. Pixley mentioned that it is normal for researchers to have to use multiple computer programs when gathering and analyzing data, and many more computer programs are utilized then the ones I used this semester.
I think the most important thing I learned through RaMP is that research requires a lot of patience. All of the lab members talked about how research is not always that exciting since a lot of the time is spent writing procedures and performing image and data analysis. In this regard, I was able to get a taste of what a lot of research consists: working independently performing the same procedure on twenty to forty images. Spending four straight hours doing the same step in the analysis process on images can become wearisome, especially when you are unable to complete that step on all of the images in a given day and know that you will need to spend at least another day to finish. There was no real way of rushing through the process, so patience became a key trait to have when going through all of the images.
For an idea of how long it can take to generate data from a set of images, the image analysis process for the immunostained eight day images ended up taking me about two and half months to finish. I will admit that sometimes, after staring at the computer screen for hours and performing the same task over and over for all of the images, I would lose focus and be unable to continue for a few minutes. The other lab members said that this was normal and that they would often take short breaks to do something other than look at the images when they did these steps. I think one of my number one takeaways from this experience is that while some of the day to day experiences of researching can seem extremely slow and a bit mind numbing in the moment, the overall process is rewarding. I felt a small thrill whenever I finished a step in the image analysis process for all of the images and I felt extremely accomplished when I finally finished a given set of images. Research requires a lot of time and work which makes finally finishing even just a step rewarding. Overall, I enjoyed my experience over the semester and I hope to continue to find more research opportunities over the next few years of college.
As a side note, over the summer, the lab plans on performing some animal experiments for a new project. I was invited to come back to see what animal experiments for research are like, which will allow me to see another side of research.
*Below is a slideshow of the presentation I gave at the end of the semester.
I mainly worked on image analysis which involved using the computer programs Photoshop, Excel, ImageJ, and SigmaPlot. I worked with two sets of images: images of tissue that were immunostained and images of tissues that were H&E stained.
For the immunostained images, I used all four computer programs to determine M1 and M2 macrophage expression. M1 macrophages are associated with the body's inflammatory response to a foreign body while M2 macrophages are associated with the body's anti-inflammatory response. I worked with images of tissue samples from day eight. Each image was taken three times at different wavelengths to capture a different stain. The three stains used were dapi for nuclei, iNOS for M1 macrophages, and ARG1 for M2 macrophages. I had to combine the three images and add colors to each layer (blue for dapi, green for M1, and red for M2). Two to three of the colored images made up an image of a larger section of tissue, so I then went in and lined up the images to produce a larger image that ends up looking like the one on the left (the banner at the top is actually a zoomed-in version of this photo). ImageJ was then used to measure the expression of the macrophages and the nuclei. These values were then compared to one another using SigmaPlot.
For the H&E stained images, the number of neutrophils in a given area of tissue was counted. Neutrophils are another indicator of the body's inflammatory response to a foreign body. For the images that were H&E stained, the number of neuclei were in a given area of tissue (the rectangle) was counted to determine neutrophil infiltration. For each image, I placed a rectangle of a certain size and counted the number of nuclei and the percent area of the nuclei within that area. A sample of what the rectangle looked like can be seen in the slide show below on the second slide. It is the image under H&E staining. I did this process twice per image to gather information from two different areas of the tissue. SigmaPlot was used to ananlyze the data in the end.
I also performed a little bit of staining, but overall, my wet lab experience was limited. For the majority of the semester, data analysis was being performed on the magnesium fabric project. I never realized how much time is spent analyzing data. If an image seemed to have something wrong with it such as the staining being off or the data collected seemed to not make sense, that part of the project had to be redone. Before I started, the lab members had already gathered the data from tissue on days one and three, so they had been analyzing the data for months before I started. The process of image analysis also taught me how valuable knowledge of different computer programs is for a researcher. Just about everyday I came into the lab I was using at least one of the four computer programs mentioned earlier. Dr. Pixley mentioned that it is normal for researchers to have to use multiple computer programs when gathering and analyzing data, and many more computer programs are utilized then the ones I used this semester.
I think the most important thing I learned through RaMP is that research requires a lot of patience. All of the lab members talked about how research is not always that exciting since a lot of the time is spent writing procedures and performing image and data analysis. In this regard, I was able to get a taste of what a lot of research consists: working independently performing the same procedure on twenty to forty images. Spending four straight hours doing the same step in the analysis process on images can become wearisome, especially when you are unable to complete that step on all of the images in a given day and know that you will need to spend at least another day to finish. There was no real way of rushing through the process, so patience became a key trait to have when going through all of the images.
For an idea of how long it can take to generate data from a set of images, the image analysis process for the immunostained eight day images ended up taking me about two and half months to finish. I will admit that sometimes, after staring at the computer screen for hours and performing the same task over and over for all of the images, I would lose focus and be unable to continue for a few minutes. The other lab members said that this was normal and that they would often take short breaks to do something other than look at the images when they did these steps. I think one of my number one takeaways from this experience is that while some of the day to day experiences of researching can seem extremely slow and a bit mind numbing in the moment, the overall process is rewarding. I felt a small thrill whenever I finished a step in the image analysis process for all of the images and I felt extremely accomplished when I finally finished a given set of images. Research requires a lot of time and work which makes finally finishing even just a step rewarding. Overall, I enjoyed my experience over the semester and I hope to continue to find more research opportunities over the next few years of college.
As a side note, over the summer, the lab plans on performing some animal experiments for a new project. I was invited to come back to see what animal experiments for research are like, which will allow me to see another side of research.
*Below is a slideshow of the presentation I gave at the end of the semester.
